Environmental Hazard Identification for Organizations
Pre-workshop Checklist
All of these downloads are free:
- Download Google Earth Pro to your laptop. Click here.
- Create a CalTopo account if you don't already have one. Use this code for a 60-day trial: https://caltopo.com/trial/D8Q81A
- Sign up for an account with Sentinel Hub: https://apps.sentinel-hub.com/eo-browser/
- Bring your laptop to the workshop!
Optional:
WRMC workshop, October 2024. This page is not meant to be self-explanatory.
Jump to:

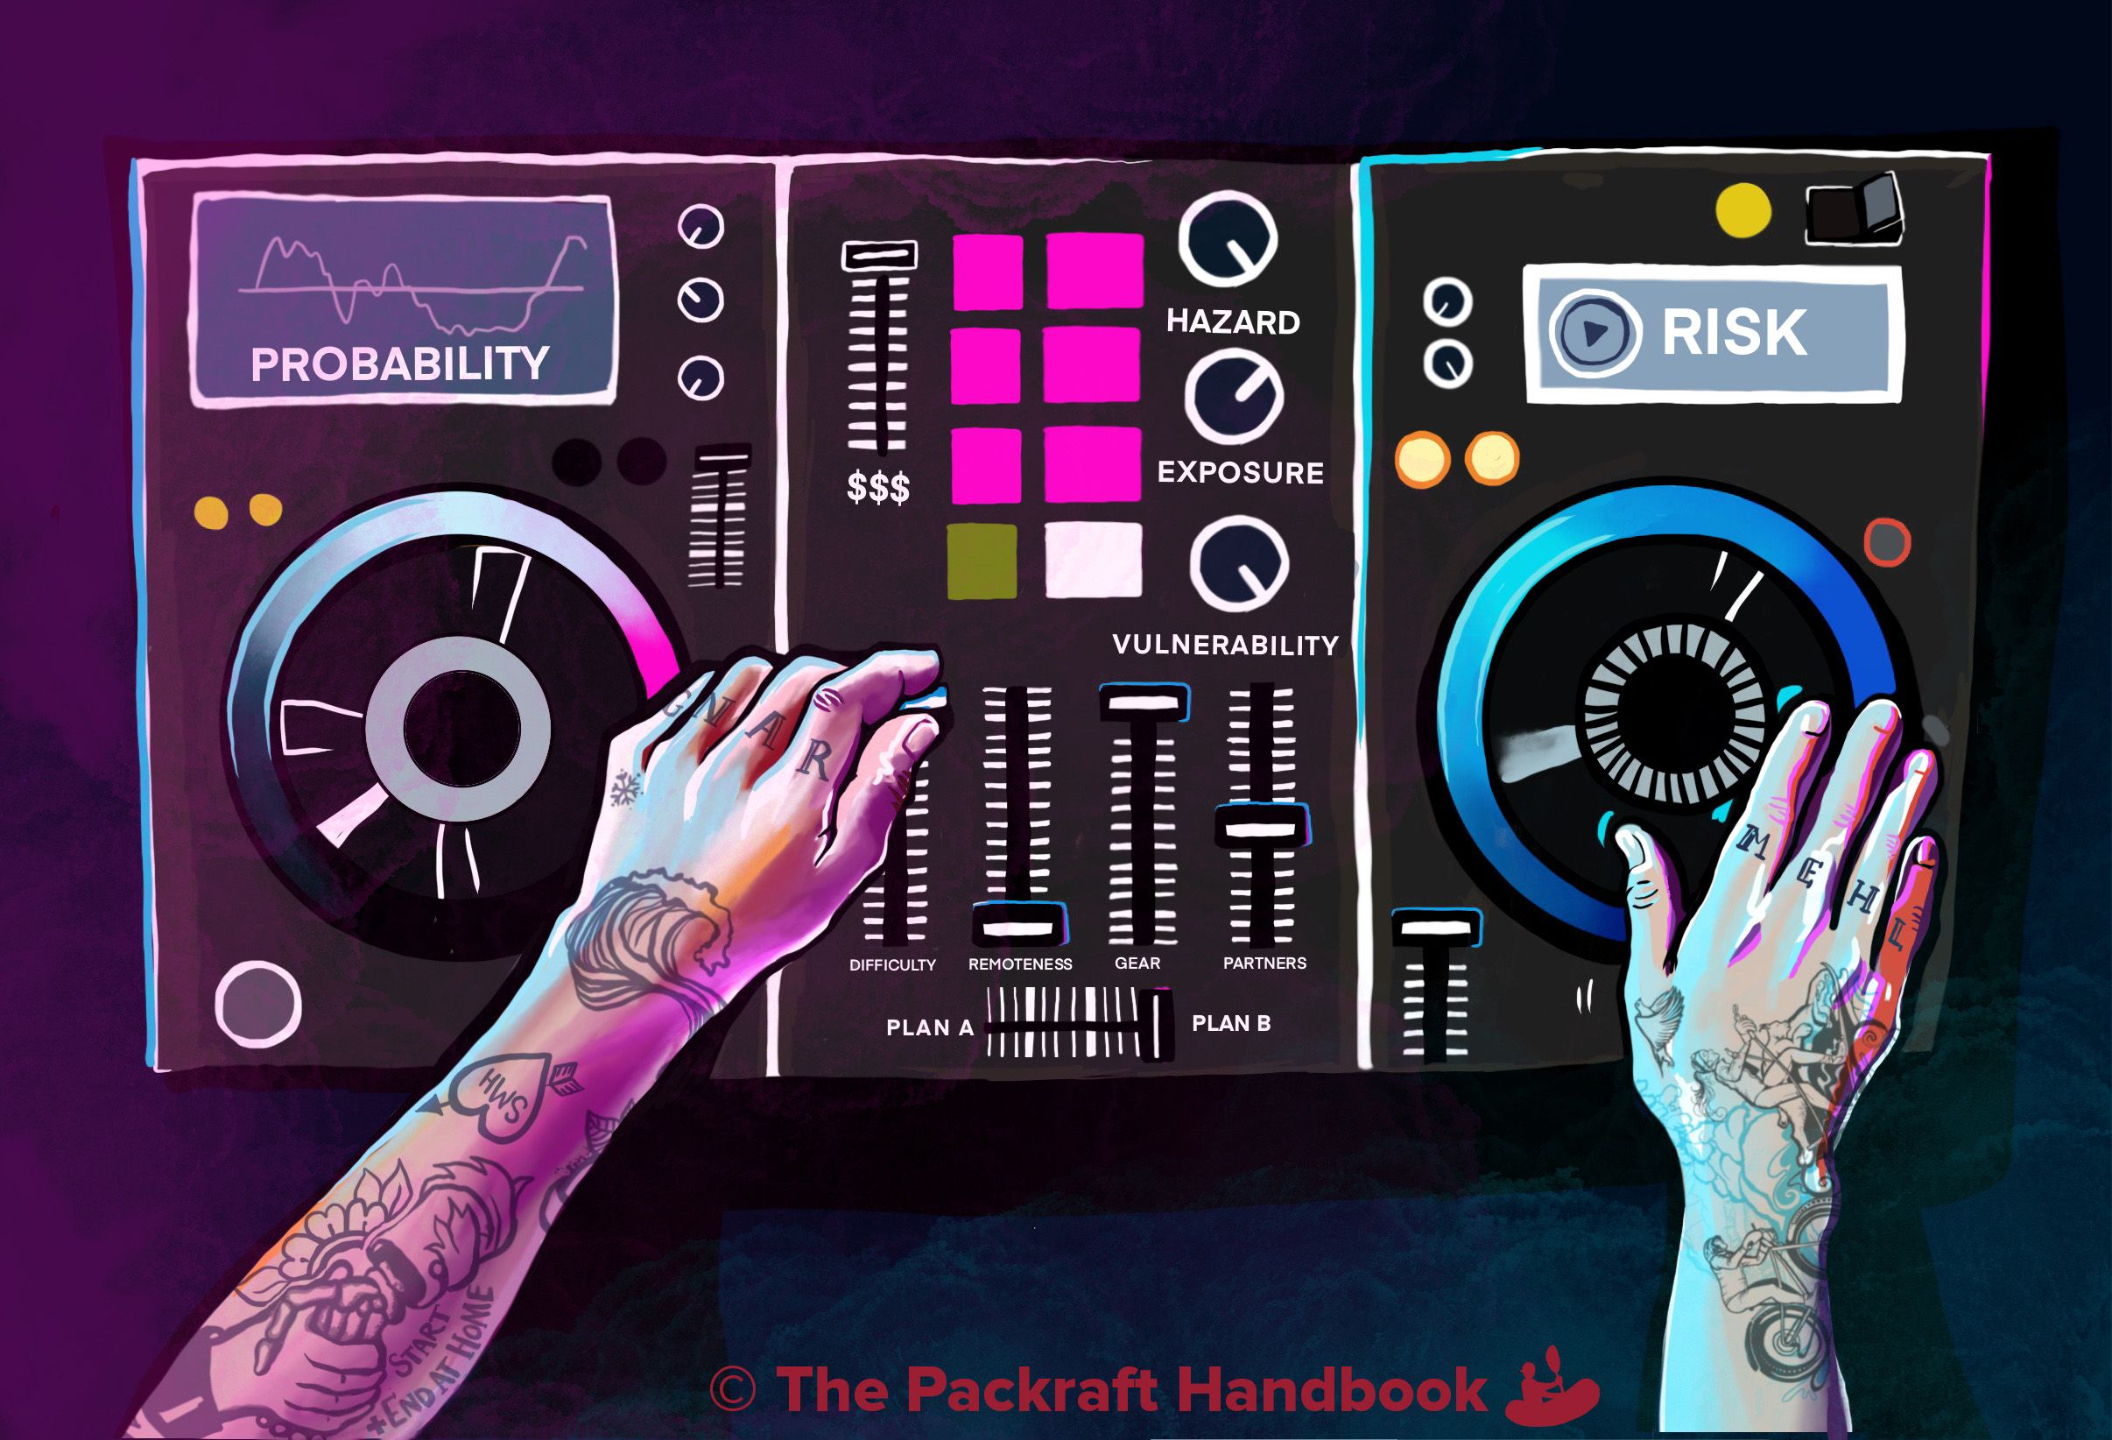
Environmental Hazards (Objective):
-
Hazard: Things that can cause harm that we have no control over (e.g., rockfall, earthquake, lightning).
-
Exposure: People/property that can be harmed.
- Vulnerability: Likelihood of harm—probability (how likely?) and consequence (how harmful?).
Since we can't control the hazards, our work is to reduce exposure and vulnerability.
We need to identify the hazards first, then we can adjust exposure and vulnerability with things like: appropriate instructor-client ratios, helmets, site cut-off levels, etc.
*Note: The outdoor industry often folds vulnerability into the other variables.
- Exposure x Vulnerability = "Degree of exposure" (e.g., plank walk height).
- Hazard x Vulnerability = Likelihood and Consequence.
An example of adjusting the dials:
What could go wrong?
- Hazard: Bee sting, anaphylaxis
- Exposure: Sarah!
- Vulnerability:
- In the backyard? Not too bad. Ambulance, hospital, etc.
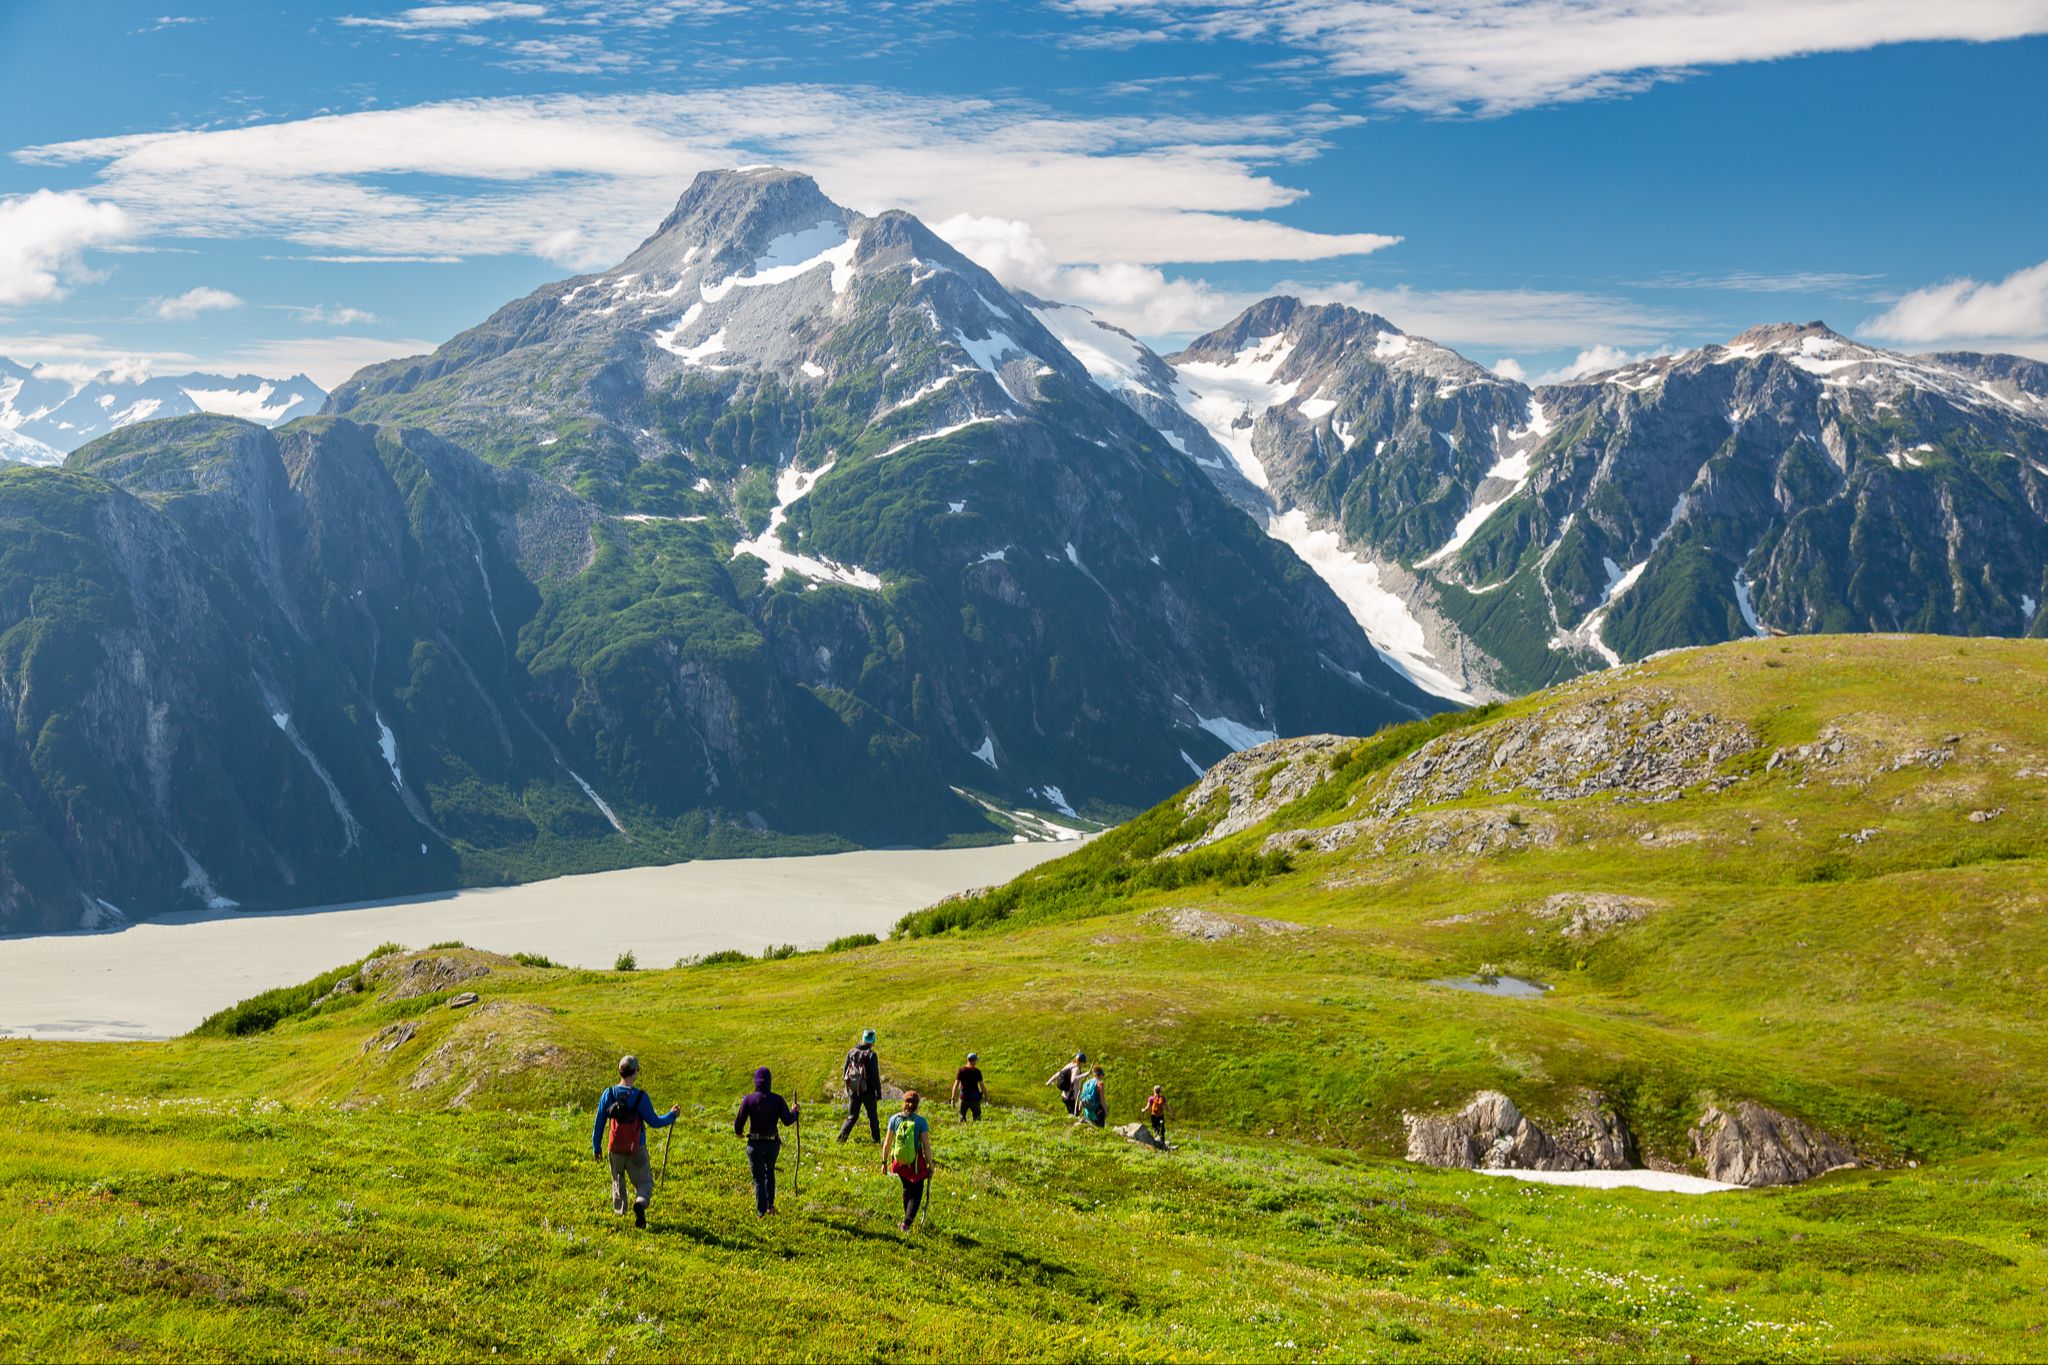
- In the Alaska Range? Extreme.
What are we going to do about it?
Human Hazards (Subjective):
Many (most?) incidents are accredited to our decision-making errors, "the human factor." Subjective hazards include poor communication, group dynamics, inadequate preparation, etc. We do have control, or at least influence, over many of these hazards.
Anticipating environmental hazards enables us to make better decisions.

Environmental Hazard Identification:
Four Components
- Geographic Features Library
- Surface Conditions: Seasonal | Recent
- Weather: Recent | Forecast
- Conditions Log
[Navigation?]
1. The Geographic Features Library
A library of the geographic features for your offerings (locations, routes, etc.) allows for easier onboarding of new hires, team discussions of Plan A and backup plans, coordination with rescue professionals, etc.
Examples include:
- Heli-skiing: Photographs and GPS tracks of ski runs.
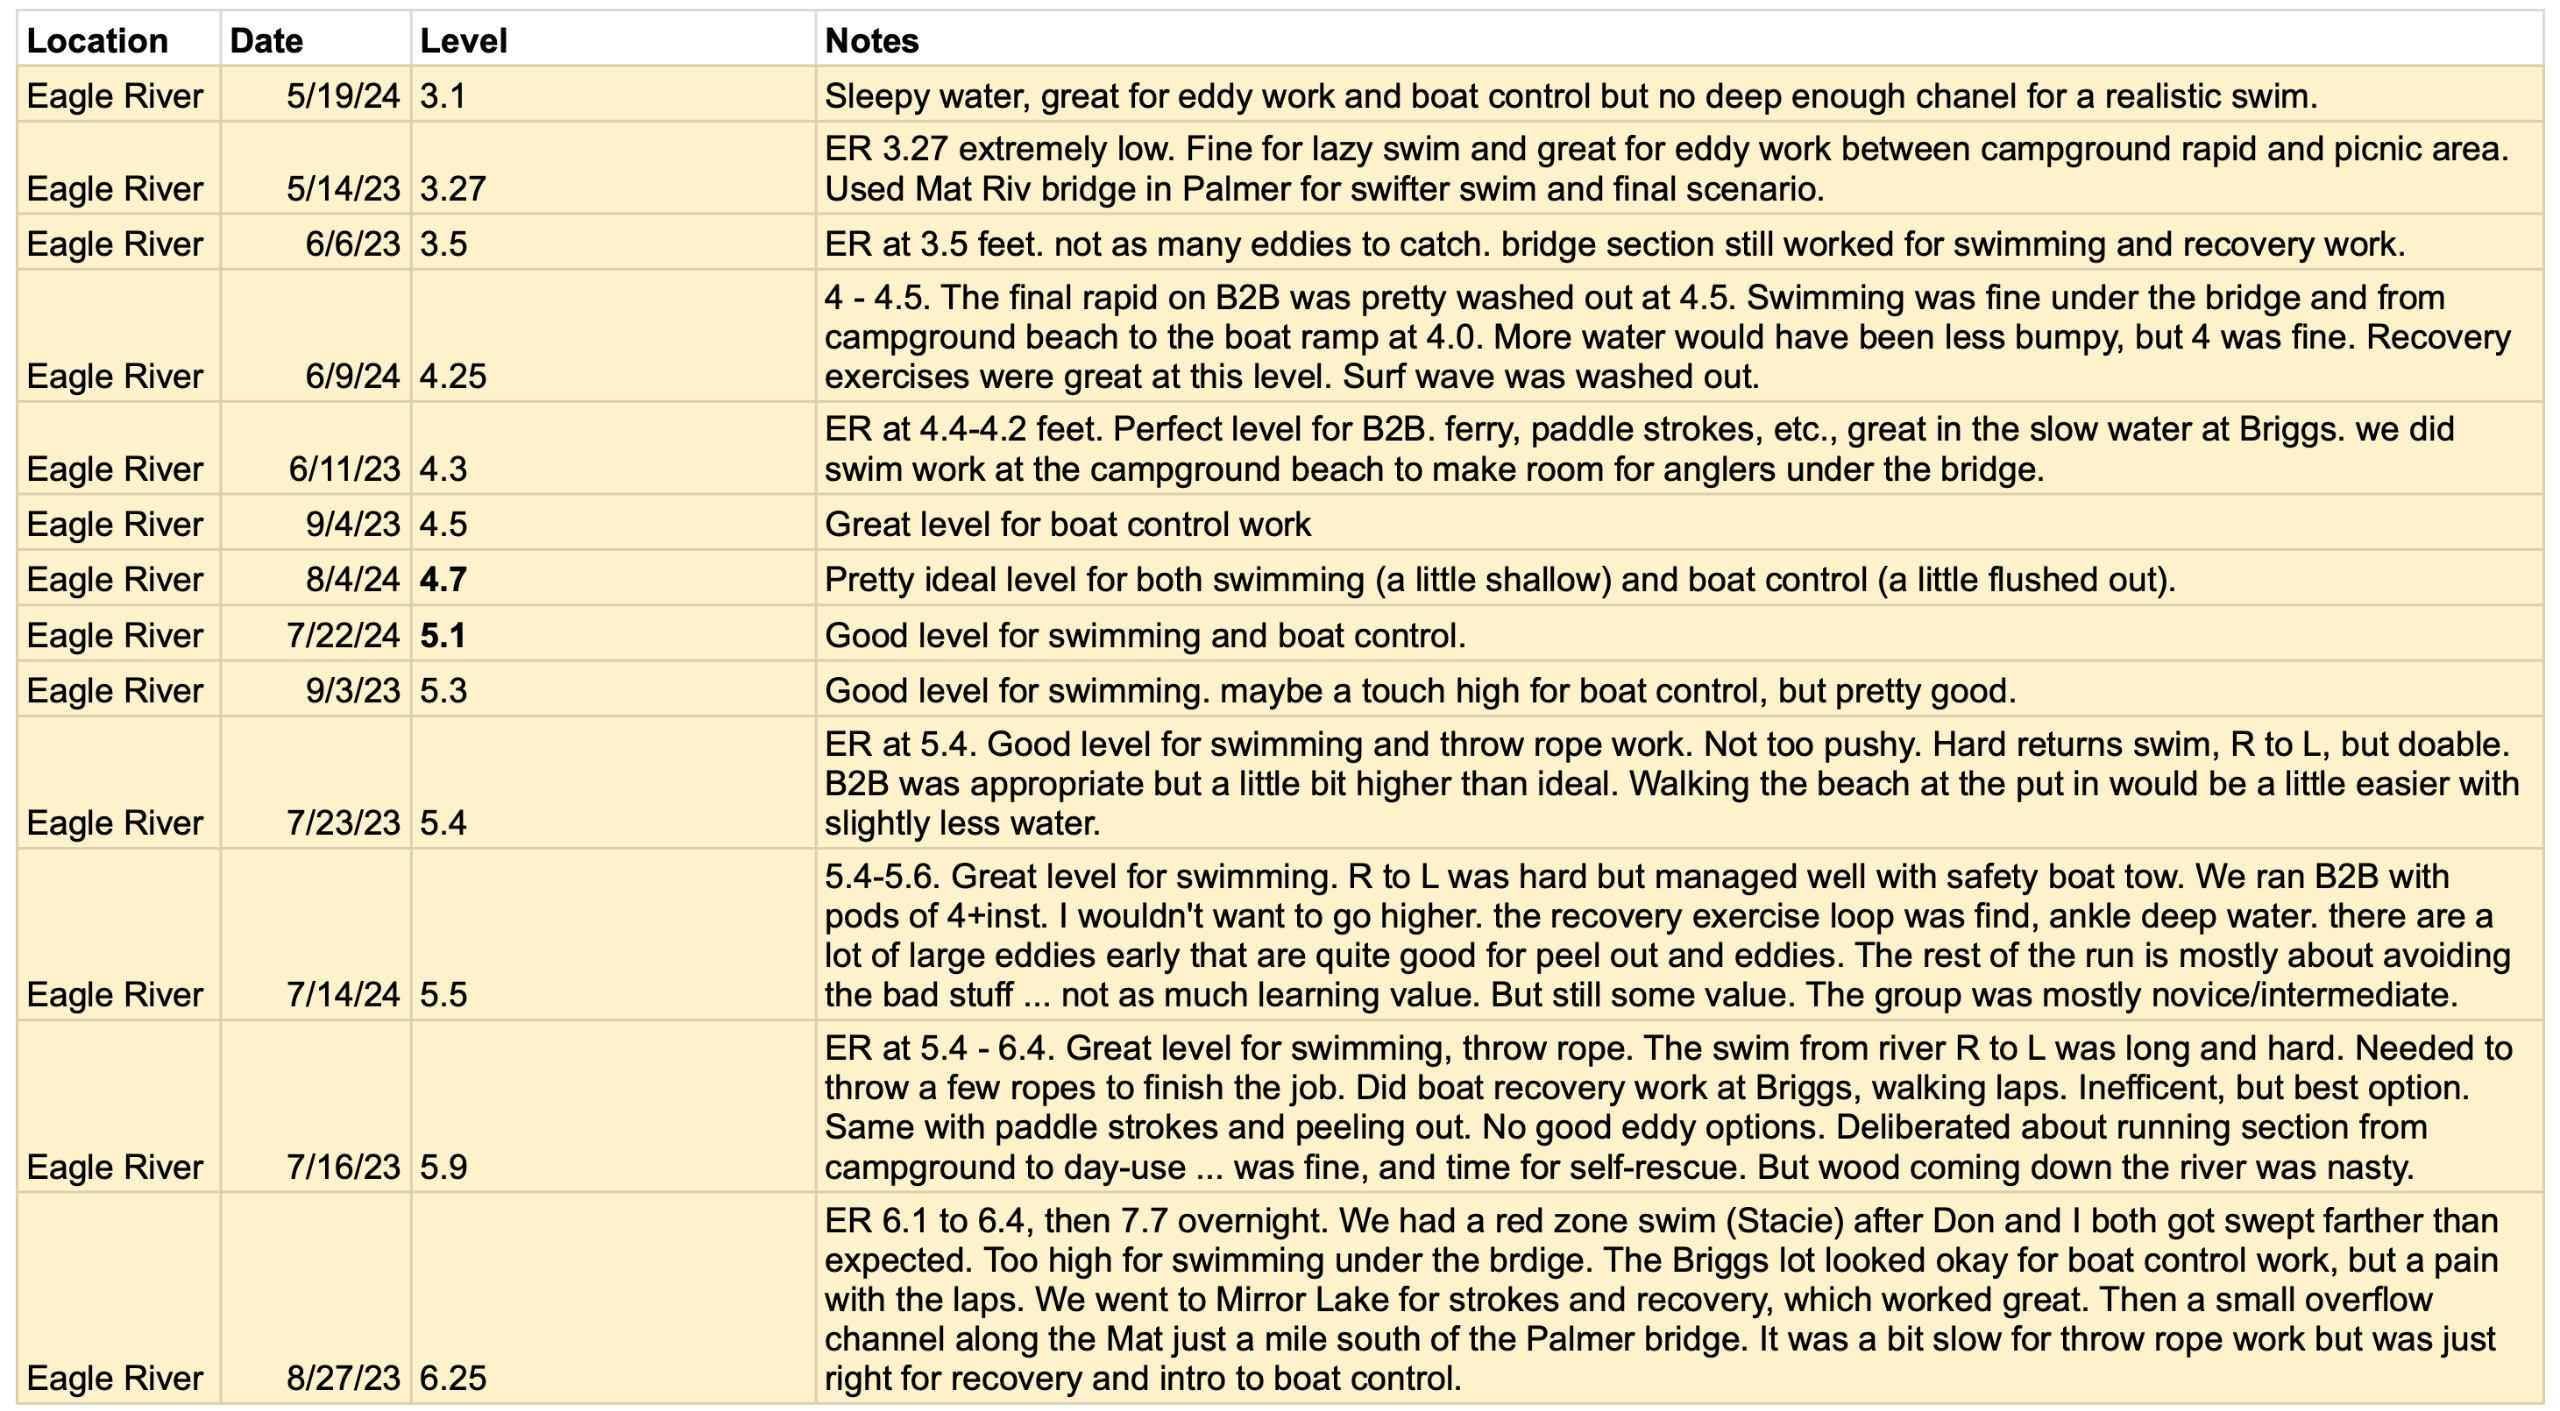
- River instruction: A spreadsheet of river sites, gauge levels, cut-off values, and notes.
- Guided backpacking: Routes and waypoints for each offering, egress locations.
Where to organize your features:

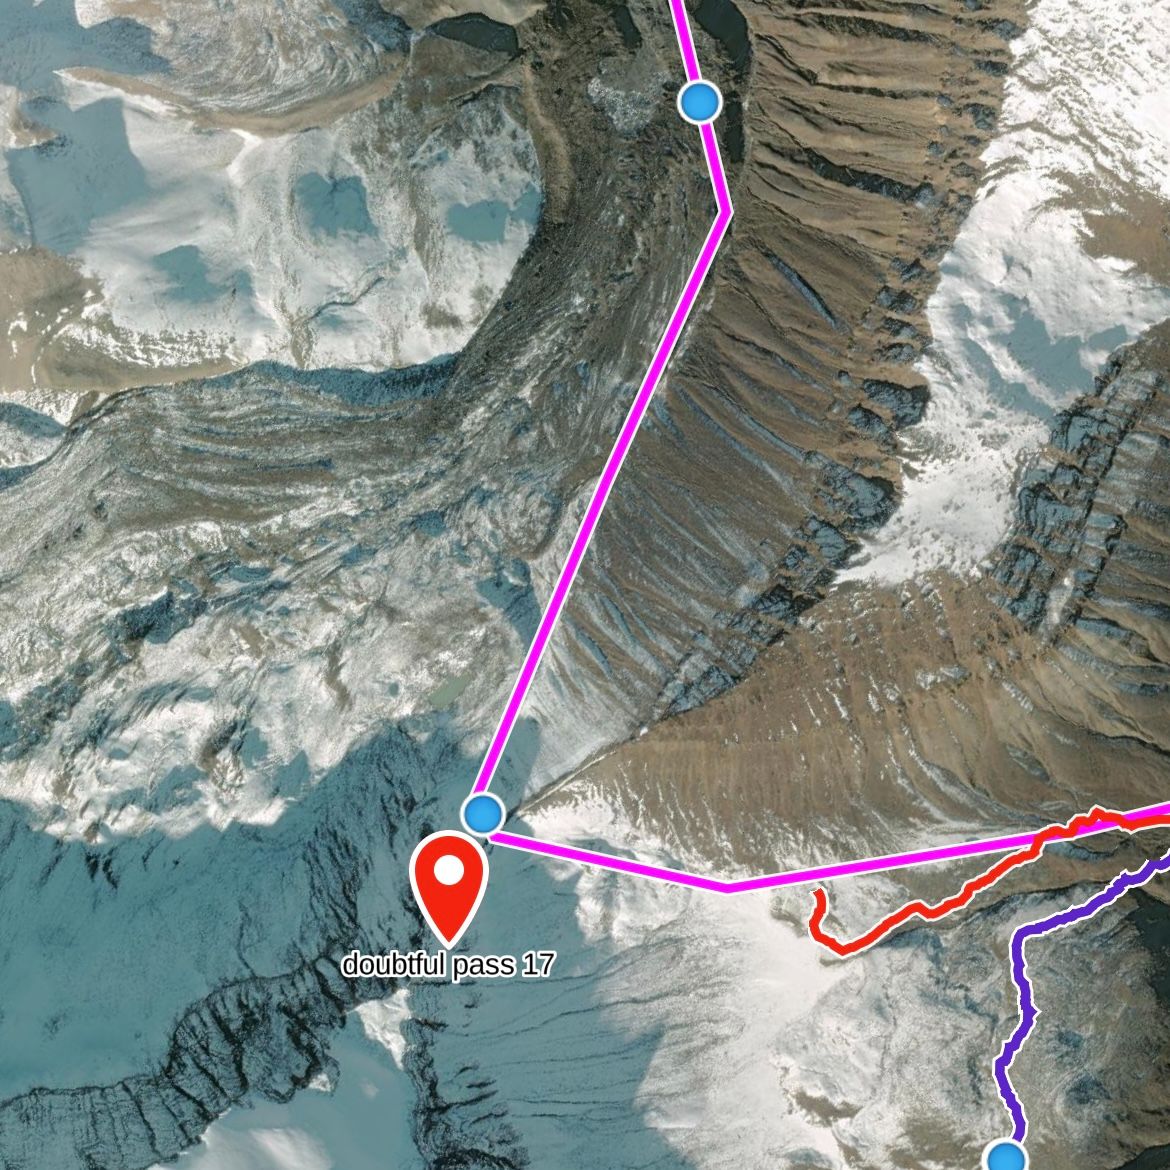
Digital Mapping and Geographic Features
Digital mapping is a collaborative way to sketch intended routes, visualize GPS tracks, identify hazards, points of interest, egress routes, etc.
- Explore the area of interest to anticipate hazards.
- Create a map with routes and/or points of interest.
- Share the map with your team and/or customers.
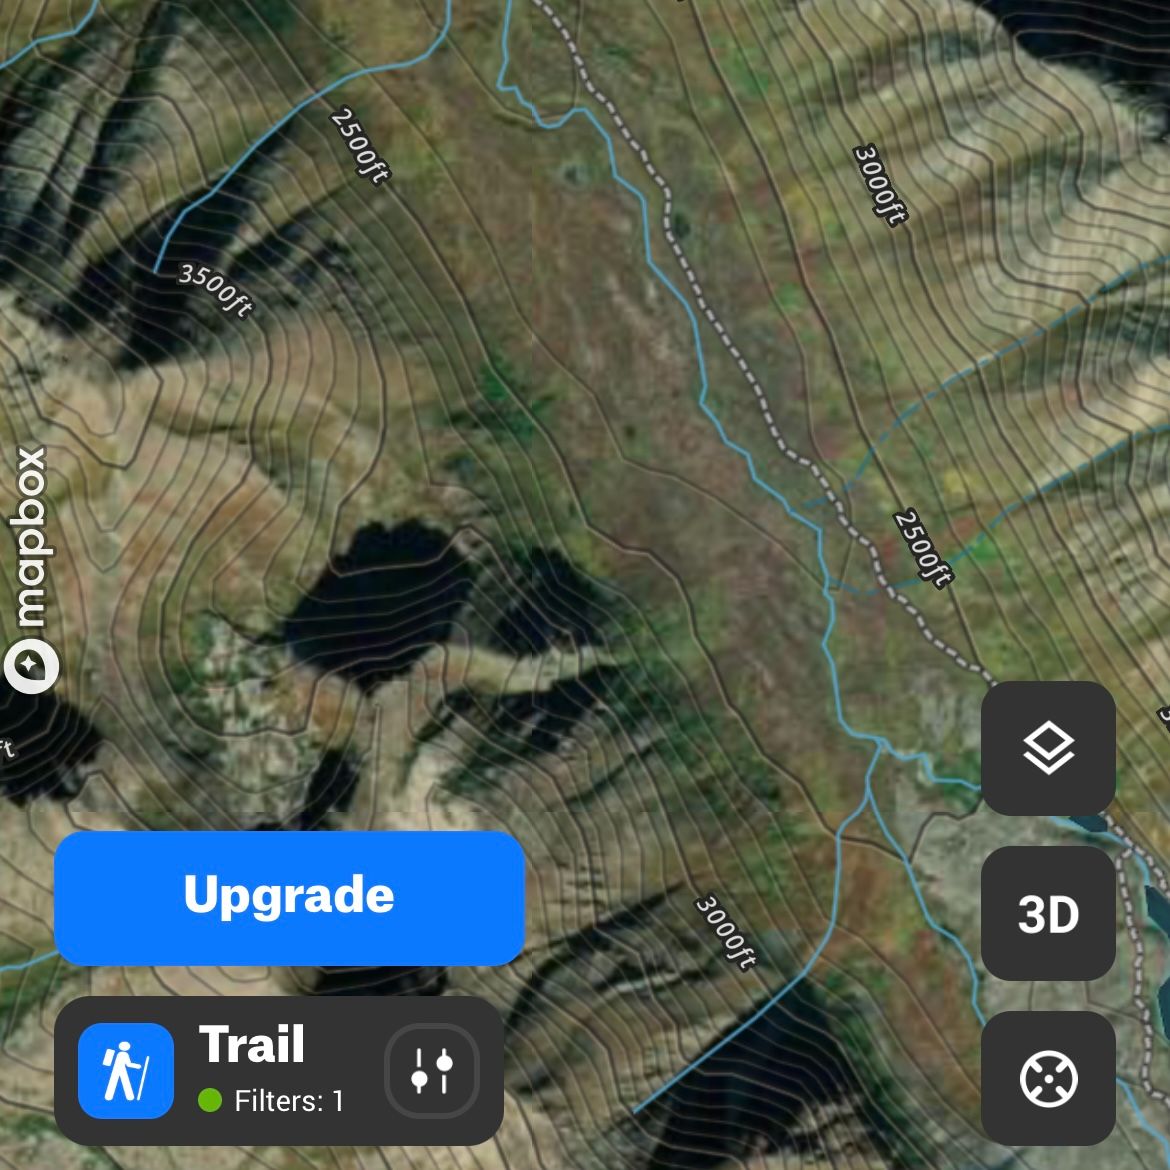
Smartphone navigation applications allow you and your clients to follow along. Digital maps are generally easy to transfer across apps and users.

Google Earth Pro (Desktop)
3D exploration and various data layers.

CalTopo
One stop shop route planning, sharing, printing.
Gaia GPS
Best introduction to navigation apps.
OnX, Strava, etc.
Alternatives to Gaia GPS.

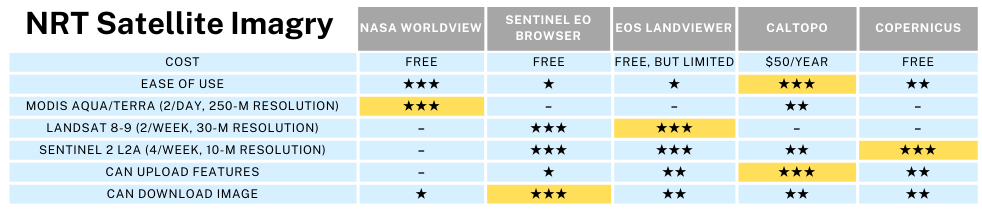
2. Surface Conditions
Use the latest satellite imagery to view the current surface conditions.
Seasonal trends: Use MODIS Aqua and Terra imagery to quickly click through seasons and years. Applications include vegetation and snow cover.
Most recent conditions: Sentinel 2 (L2A) provides the highest resolution free imagery approximately 3 times/week. Landsat 8-9 is the next best, and then MODIS. Applications include: wildfire smoke, snow level, snow bridges on rivers, etc.
Websites:
NASA Worldview: MODIS Aqua/Terra
Copernicus: Easy pan view of Sentinel 2
Sentinel EO Browser: Deeper dive into Landsat 8-9 and Sentinel 2
EOS LandViewer: Another option for Landsat 8-9 and Sentinel 2
CalTopo: MODIS Aqua/Terra and 9 and Sentinel 2

MODIS
Most frequent (daily). 250-m resolution.

Landsat 8-9
Least frequent (~2/wk). 30-m resolution.

Sentinel 2 L2A
Less frequent (~4/wk). 10-m resolution.
3. Weather
Recent weather: Review the recent weather to anticipate weather-related hazards. For example: High water or flooding due to recent rain.
Forecast weather: Use a meteogram view to evaluate the 'when and how much.'
Environmental sensors: Some outings might benefit from checking sensor data such as water level, snow depth, etc.
Websites:
Windy.com for recent weather and forecasts.
USGS Streamflow conditions
SnoTel

Recent
Use recent weather history to anticipate hazards.

Forecast
Meteogram: 'When and how much.'

Sensors
Compare cut-off values to current conditions.
4. Conditions Log
Record a conditions report after each outing to better understand likely hazards, ideal conditions, and cut-off values.
At those conditions:
- How well did the activities go?
- What was most likely to go wrong?
- Would more/less {snow | water | heat | cold | etc.} have made conditions better/worse?
Platform options: The platform to record your conditions log will depend on your applications. Here are a few options:
- Spreadsheet
- Annotations in GE / CalTopo
- Text document of post-trip reports

Next Steps
1. Getting over the technical hurdle: Your comfort with each of these tools will increase with use, especially if you revisit the application after the outing. For example:
- Scan the near-real-time satellite imagery after your trip to 'groundtruth' what you just experienced.
- Use the meteogram view of the windy.com app on your phone (free) to get more familiar with the app and the forecast accuracy.
2. Moving from identification to assessment: Create a prevention/mitigation plan for your most probable hazards.
3. Checklists: It might be helpful to create a checklist of environmental hazards that are relevant to your work. The example below is from a 'Trip Plan Document' that I use and teach for recreational outings. You can view the full document here.
4. Feedback: Let me know which of these systems are useful to you and what is missing! My approach is an iterative process of learning and improving through use and peer feedback. There is a Contact menu item at the top of this page.

